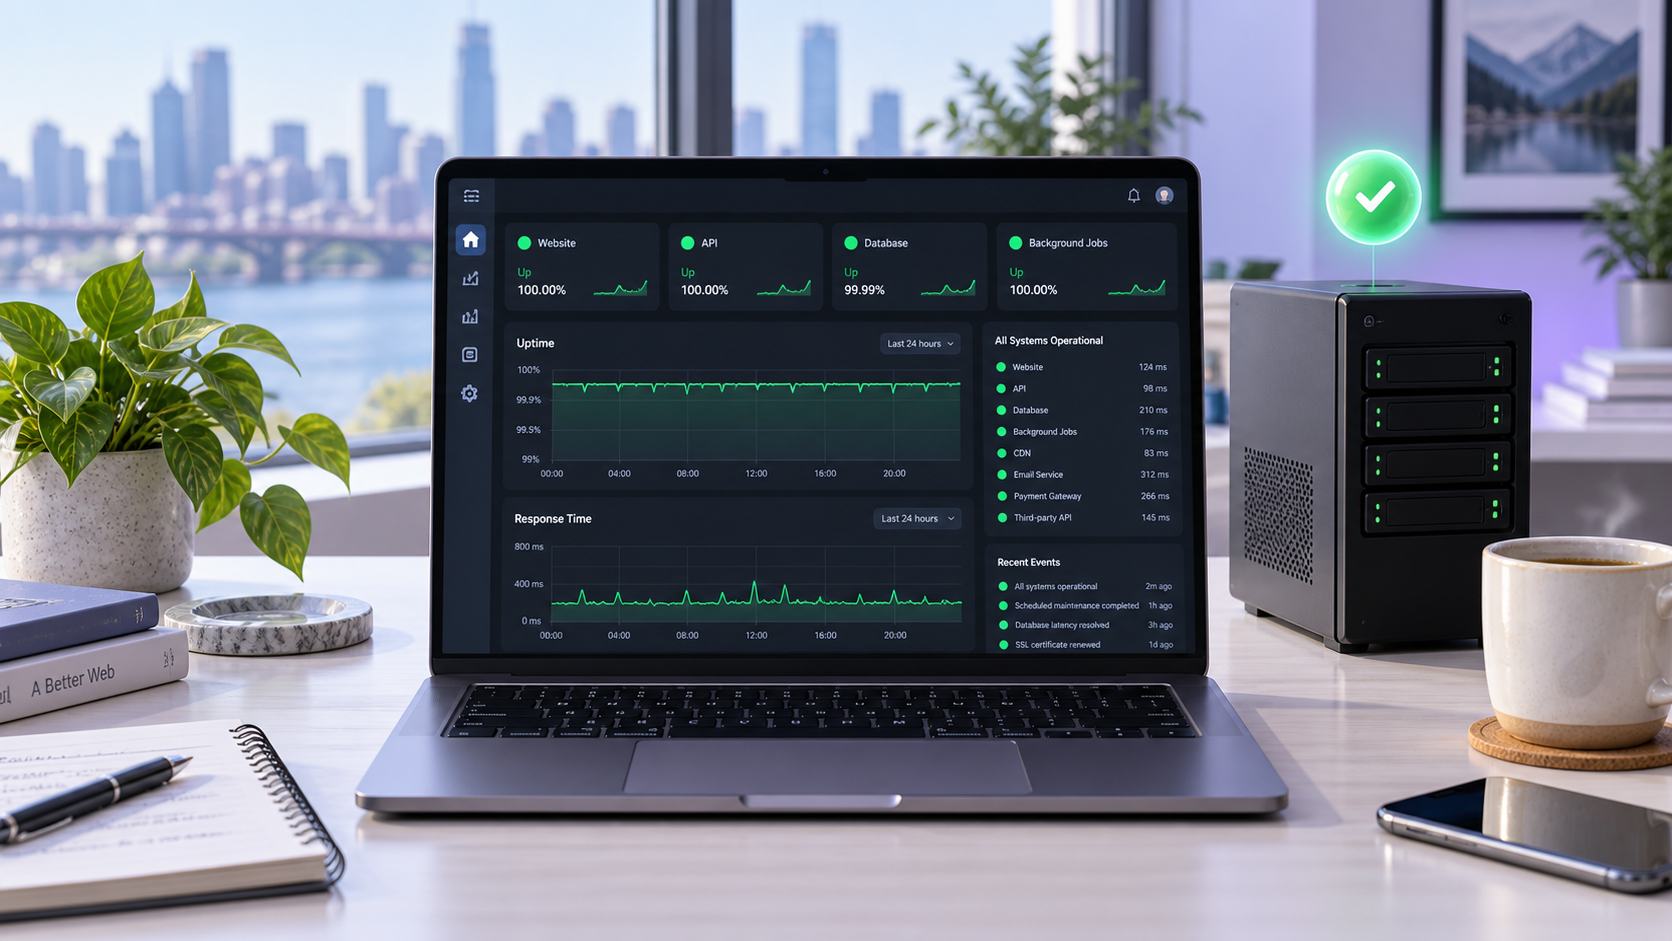
Website downtime can cost a small business sales, leads, search visibility, and customer trust. A free uptime monitoring tool can warn you when a website, API, server, SSL certificate, or domain becomes unavailable.
The best free uptime monitor for most users is UptimeRobot. It supports 50 monitors with five-minute checks and allows commercial use. Better Stack is better for teams that need incident management and status pages, while StatusCake is useful when you also want basic page-speed, domain, and SSL monitoring.
This guide compares the 10 best free uptime monitoring tools in 2026, including free-plan limits, monitoring types, alerting, status pages, and the situations where each tool makes sense.
Choosing a new host as well? Compare our web hosting providers for uptime, renewal costs and workload requirements, then use independent monitoring to track your own website.
Best free uptime monitors
| Tool | Best for | Free allowance | Check interval | Status page |
|---|---|---|---|---|
| UptimeRobot | Most websites and APIs | 50 monitors | 5 minutes | Yes |
| Better Stack | Incident response | 10 monitors and 10 heartbeats | 3 minutes | Yes |
| StatusCake | Website health checks | 10 uptime monitors | 5 minutes | Available |
| HetrixTools | Uptime and blacklist monitoring | Limited free monitors | Varies | Limited |
| Uptimia | Small businesses | 1 uptime and 1 API monitor | 5 minutes | Yes |
| Updown.io | Flexible low-cost monitoring | Free credits | From 15 seconds | Yes |
| Webalert | Simple website monitoring | Limited free plan | About 10 minutes | Yes |
| Montastic | Basic HTTP checks | Limited free monitoring | Varies | No or limited |
| Cronitor | Cron jobs and background tasks | Limited free plan | Event-based | Limited |
| Cabot | Self-hosted monitoring | Open-source software | User-configured | Self-hosted |
Free-plan limits can change. Confirm current quotas, retention, alert channels, and commercial-use rules before depending on a tool for production infrastructure.
What is uptime monitoring?
Uptime monitoring is an automated check that tests whether a website or service is reachable and functioning.
A monitor may send an HTTP request to a URL every few minutes. If the server returns an error, stops responding, or fails a keyword check, the monitoring service sends an alert.
- Uptime tools can monitor:
- Websites.
- APIs.
- TCP and UDP ports.
- SSL certificates.
- Domain expiry dates.
- DNS records.
- Cron jobs.
- Background workers.
- Server heartbeats.
- Checkout and login workflows.
- Response content.
A simple HTTP check answers, “Did the server respond?” A keyword check answers, “Did the response contain the content users expect?” A transaction monitor goes further by testing an actual sequence, such as login, product search, cart, and checkout.
1. UptimeRobot: Best overall
UptimeRobot is the best free uptime monitoring tool for most websites, small businesses, developers, and agencies.
Its free plan includes 50 monitors, five-minute checks, a public status page, mobile apps, and email alerts. The provider says the free plan is permanent and can be used for commercial and business purposes (uptimerobot.com).
Supported monitor types
- HTTP and HTTPS.
- Ping.
- TCP port.
- UDP port.
- Keyword monitoring.
- SSL certificate monitoring.
- Domain monitoring on relevant plans.
A keyword monitor checks whether a page contains or does not contain specific text. For example, it can detect whether a homepage still displays “Database connection error” even though the server returns HTTP 200.
Why choose UptimeRobot?
- 50 free monitors is generous.
- Simple setup.
- Suitable for commercial sites.
- Public status page included.
- Mobile apps available.
- Multiple alert integrations.
- Useful for websites, APIs, and ports.
Limitations
Free checks run every five minutes. That means a short outage may last several minutes before detection. Faster one-minute checks, longer history, and more advanced alerting require a paid plan.
The free tier is also better at availability monitoring than full incident response. It will alert you, but it does not provide the same depth of on-call scheduling and event correlation as Better Stack.
Best for: Websites, APIs, client sites, side projects, and small business infrastructure.
2. Better Stack: Best for incident response
Better Stack combines uptime monitoring with incident management, on-call schedules, status pages, logs, and operational workflows.
Its free uptime tier includes 10 monitors, 10 heartbeat monitors, one status page, and checks around every three minutes, according to current 2026 comparison data (web-alert.io).
A heartbeat monitor checks whether a scheduled task reports in on time. It is useful for backups, cron jobs, data imports, report generation, and payment reconciliation tasks.
Why choose Better Stack?
- Uptime checks.
- Heartbeat monitoring.
- Incident timelines.
- On-call scheduling.
- Escalation policies.
- Public status pages.
- Log and monitoring integrations.
- Team-based alert handling.
An escalation policy determines who receives an alert and what happens if the first responder does not acknowledge it. This matters when a production outage occurs outside business hours.
Better Stack also supports monitoring private HTTP services through an authenticated proxy. That allows teams to monitor internal endpoints without exposing them directly to the public Internet (betterstack.com).
Limitations
The free allowance is smaller than UptimeRobot’s. Team members, phone notifications, retention, and incident-response capabilities may be restricted by plan.
Best for: Small SaaS teams, developers operating APIs, and businesses that need more than an email alert.
3. StatusCake: Best for website health
StatusCake is useful when uptime is only one part of your monitoring requirements. Its free plan includes 10 uptime monitors with five-minute checks, one page-speed monitor, one domain monitor, and one SSL monitor (statuscake.com).
What it monitors
- Website availability.
- Page load speed.
- SSL expiration.
- Domain expiration.
- Server health on supported plans.
- Response content.
- Multiple test locations.
The free page-speed monitor can help identify performance regressions that a basic uptime check misses. A website may technically be online while taking 12 seconds to load.
Why choose StatusCake?
- Uptime and page-speed monitoring in one account.
- SSL and domain checks.
- Test locations in multiple countries.
- Alerts through integrations.
- Useful dashboard for agencies and website owners.
Important change in 2026
Freshping was discontinued, with free accounts stopping on March 6, 2026. StatusCake positioned its free plan as an alternative and expanded the relevance of its website-health monitoring features (statuscake.com).
Limitations
The free plan has separate quotas for uptime, page speed, domains, and SSL checks. Faster intervals and larger monitor pools are paid.
Best for: Business websites, agencies, and users who want uptime, speed, domain, and SSL checks together.
4. HetrixTools: Best for blacklist monitoring
HetrixTools combines uptime monitoring with server monitoring, blacklist checks, and IP reputation tools.
This makes it useful for hosting providers, agencies, email operators, and businesses that depend on clean IP addresses.
Useful features
- Uptime monitoring.
- Server resource monitoring.
- IP blacklist monitoring.
- Domain blacklist monitoring.
- SSL checks.
- Webhook alerts.
- Public monitoring pages.
- Server agents for deeper metrics.
A blacklist monitor checks whether a domain or IP address appears on known abuse or spam blocklists. This is especially important for mail servers and shared hosting environments.
Why choose HetrixTools?
- Strong focus on IP reputation.
- Useful for server operators.
- More than simple HTTP checks.
- Supports infrastructure-related monitoring.
- Can identify blacklist problems early.
Limitations
The free plan has lower monitor allowances than UptimeRobot. Some features also require installing an agent or configuring DNS and server access.
Best for: Hosting companies, mail servers, agencies, and administrators monitoring IP reputation.
5. Uptimia: Best for small businesses
Uptimia offers a free plan with one uptime monitor, one API monitor, and one public status page. Free checks run at five-minute intervals, and the provider says the plan remains free after its 30-day trial (uptimia.com).
Features
- Website uptime.
- API monitoring.
- Keyword checks.
- SSL monitoring.
- Domain expiry monitoring.
- Page-speed monitoring.
- Transaction checks on trial or paid plans.
- Status pages.
- Reports.
The platform monitors from many global checkpoints. Multi-location monitoring helps distinguish a local network problem from a global outage.
Why choose Uptimia?
- Simple small-business plan.
- API monitoring included.
- Status page included.
- Keyword checks are available.
- No credit card required for the trial.
- Additional monitoring types can be tested before upgrading.
Limitations
One uptime monitor is not enough for a large website portfolio. The free plan also has limited history and check frequency.
Best for: A small company with one website and one API endpoint.
6. Updown.io: Best for flexible check frequency
Updown.io uses a credit-based model. The service allows monitoring intervals from 15 seconds to one hour, and its pricing scales with the number of checks. It also provides free credits for new accounts (updown.io).
This model is different from the fixed monitor quotas used by UptimeRobot or StatusCake.
Why choose Updown.io?
- Flexible intervals.
- HTTP and keyword checks.
- Response-time graphs.
- Public status pages.
- Webhooks and integrations.
- Credit-based usage.
- Suitable for developers who want precise control.
The service can be cost-effective when you monitor only a few endpoints. You pay for checks rather than buying a large feature bundle.
Limitations
Free credits eventually run out. The pricing model can also be less predictable if you increase monitoring frequency.
A single endpoint checked every 15 seconds creates far more requests than one checked every five minutes.
Best for: Developers, APIs, performance-sensitive services, and users who need intervals below one minute.
7. Webalert: Best for simple monitoring
Webalert is a lightweight uptime monitoring service aimed at users who want straightforward availability checks without a large operations platform.
Its free offering includes a small number of monitors, longer check intervals, and a basic status page. Current comparison data lists approximately three free monitors with checks around every 10 minutes (web-alert.io).
Useful features
- HTTP and HTTPS monitoring.
- Response-code checks.
- Keyword monitoring.
- Status page.
- Email alerts.
- Basic integrations.
Why choose Webalert?
- Minimal configuration.
- Easy for personal websites.
- Useful for a few endpoints.
- Low operational complexity.
- Suitable for testing a monitoring workflow.
Limitations
The free monitor count and interval are restrictive for production applications. It is better for personal projects, small portfolios, or secondary checks than for a large client fleet.
Best for: Personal projects, small websites, and simple secondary monitoring.
8. Montastic: Best for basic HTTP checks
Montastic is an older, simple website monitoring option. It focuses on checking whether a web page responds successfully and notifying you when it does not.
Why choose Montastic?
- Simple setup.
- Basic HTTP monitoring.
- Low learning curve.
- Suitable for a small number of websites.
Limitations
It does not offer the broader incident-management, infrastructure, and API features found in newer platforms. Free limits and current product capabilities should be verified before relying on it.
Montastic is best treated as a basic availability checker rather than a complete observability platform.
Best for: Simple websites that need a basic external check.
9. Cronitor: Best for cron jobs
Cronitor is designed for monitoring scheduled tasks, background jobs, and cron processes. It can also monitor websites and APIs, but its strongest use case is detecting jobs that silently fail.
- A cron job is a scheduled command that runs automatically on a server. Examples include:
- Database backups.
- Invoice generation.
- Product-feed imports.
- Email digests.
- Data synchronization.
- Certificate renewal.
- Cleanup scripts.
How heartbeat monitoring works
You place a Cronitor URL in the job. The task sends a signal when it starts, completes, or fails. Cronitor alerts you if the expected signal does not arrive.
This is more reliable than assuming a scheduled command worked because the operating system launched it.
Limitations
The free tier is designed for limited use. Larger job fleets, team features, retention, and advanced integrations may require payment.
Best for: Developers monitoring scheduled commands and backend workers.
10. Cabot: Best self-hosted option
Cabot is an open-source monitoring platform that you can deploy on your own infrastructure. It can monitor services and send alerts through configured notification channels.
Self-hosting means you control the monitoring software and data. It can be useful when you need internal monitoring without sending endpoint details to a commercial SaaS provider.
Why choose Cabot?
- Open-source.
- Self-hosted.
- Customizable.
- Suitable for internal services.
- No recurring SaaS subscription.
- Can be integrated with existing infrastructure.
Limitations
- You are responsible for:
- Hosting the monitor.
- Upgrading the software.
- Securing the dashboard.
- Backing up configuration.
- Maintaining alert delivery.
- Ensuring the monitoring server is separate from the monitored service.
Do not run the monitoring server on the same machine as your website. If the server fails, both the service and the monitor disappear at the same time.
Best for: Developers and teams comfortable managing open-source infrastructure.
What should you monitor?
Monitoring only the homepage is not enough. Add checks for the services that affect revenue or users.
Website
Monitor the homepage, important landing pages, and a page that loads from the database.
API
Check an authenticated health endpoint or a lightweight endpoint that verifies application dependencies.
Database
Use internal health checks rather than exposing the database port publicly.
SSL certificate
Alert before the certificate expires. A valid certificate is essential for HTTPS and user trust.
Domain name
Monitor domain expiration and DNS changes. A forgotten domain renewal can take down an otherwise healthy website.
Background jobs
Use heartbeat monitoring for backups, queues, imports, and scheduled reports.
Payment workflows
Use a synthetic transaction monitor where available. A synthetic transaction is an automated simulation of a user journey, such as signing in, adding an item to a cart, and reaching checkout.
Uptime monitoring best practices
Use an external monitoring location
Do not rely only on a local server agent. External checks can detect DNS failures, routing problems, firewall mistakes, and complete data-center outages.
Monitor from multiple regions
A single monitoring location can produce false alarms because of local Internet problems. Multi-region checks improve confidence.
Avoid alert fatigue
Do not alert on every small latency fluctuation. Use retry logic, consecutive failures, and sensible thresholds.
A practical rule is to alert after two or three failed checks unless the service is extremely sensitive.
Create escalation rules
- Email is useful for low-priority issues. Production systems may need:
- Slack or Microsoft Teams.
- Webhooks.
- PagerDuty.
- Phone calls.
- SMS.
- On-call rotations.
Build a status page
A public status page lets customers see whether an outage is known. It can reduce duplicate support requests while your team investigates.
Pair uptime with performance monitoring
Uptime monitoring tells you whether a service responds. It does not necessarily explain why it is slow.
- Add:
- Response-time tracking.
- Server CPU and memory monitoring.
- Error tracking.
- Log aggregation.
- Database metrics.
- Real-user monitoring.
- Real-user monitoring, or RUM, measures performance from actual visitors’ browsers and locations.
Uptime versus availability
- Uptime is usually expressed as a percentage of time a service was reachable.
- For a 30-day month:
- 99% uptime allows about 7 hours and 12 minutes of downtime.
- 99.9% allows about 43 minutes and 12 seconds.
- 99.99% allows about 4 minutes and 19 seconds.
- The calculation is:
Downtime = total period × (1 − uptime ÷ 100)
Enter uptime as a percentage, such as 99.9.
Final verdict
UptimeRobot is the best free uptime monitoring tool for most websites because its free plan supports 50 monitors, five-minute checks, public status pages, mobile apps, and commercial use (uptimerobot.com).
Choose Better Stack if you need incident management, heartbeats, and on-call workflows. Choose StatusCake for a broader website-health view that includes page speed, SSL, and domain monitoring. Uptimia is a good fit for one small business website and an API.
Developers should consider Cronitor for scheduled jobs, Updown.io for flexible check frequencies, and Cabot when self-hosting is important.
For a production website, use uptime monitoring as the first layer—not the entire monitoring strategy. Combine external availability checks with application logs, performance metrics, SSL alerts, backups, and a tested incident-response process.